


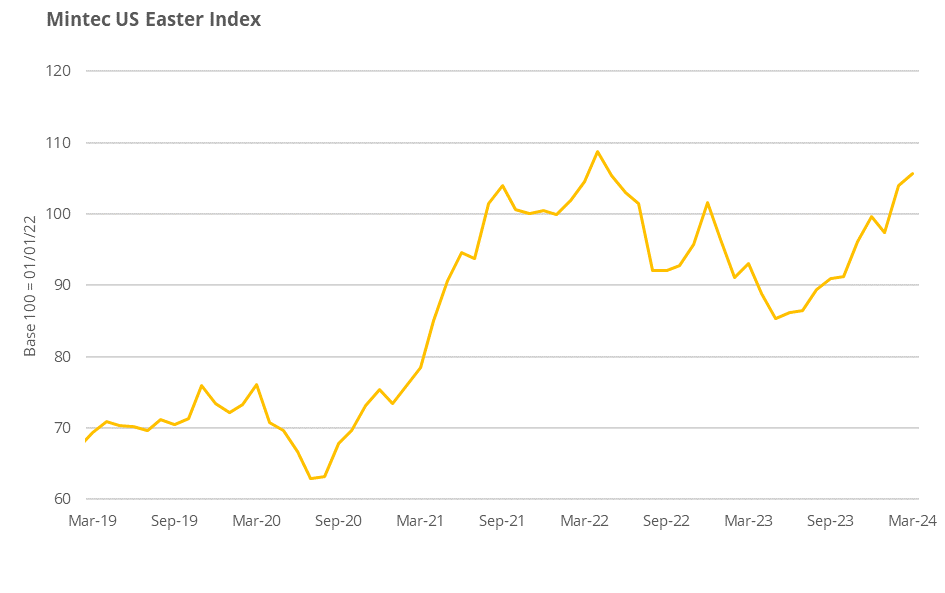
Mintec’s US Easter Index measures price fluctuations across key food commodities that are typically consumed in the US during the Easter period. The US Easter Index compares the commodities’ prices in March 2024 against March 2023 to determine whether consumers will be hypothetically better or worse off this Easter. The Index is comprised of three sub-indices: the US Easter Protein Index represents a selection of meats, fish and eggs that will typically be eaten as part of a main Easter dinner; the US Easter Chocolate Index compares the main ingredients used to manufacture chocolate Easter eggs, a traditional confectionery consumed in the US; the US Easter Bakery Index looks at various ingredients used to make pastries and other baked treats eaten during Easter.
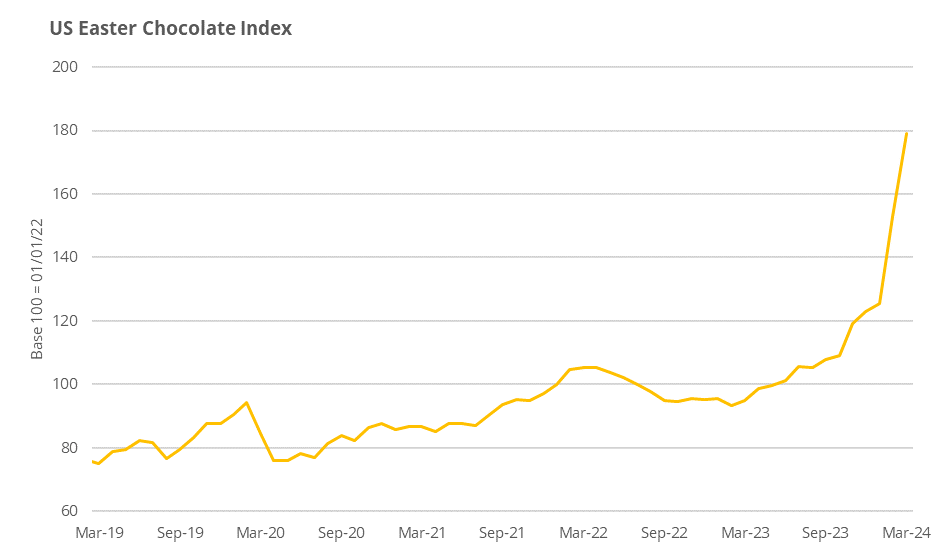
Chocolate is commanding considerable media coverage due to surging cocoa prices, which have surged since the start of the year. Cocoa price inflation contributed to the US Chocolate Index surging by 88.8% year-on-year (y-o-y), which underpinned a 13.5% y-o-y rise in the overall US Easter Index
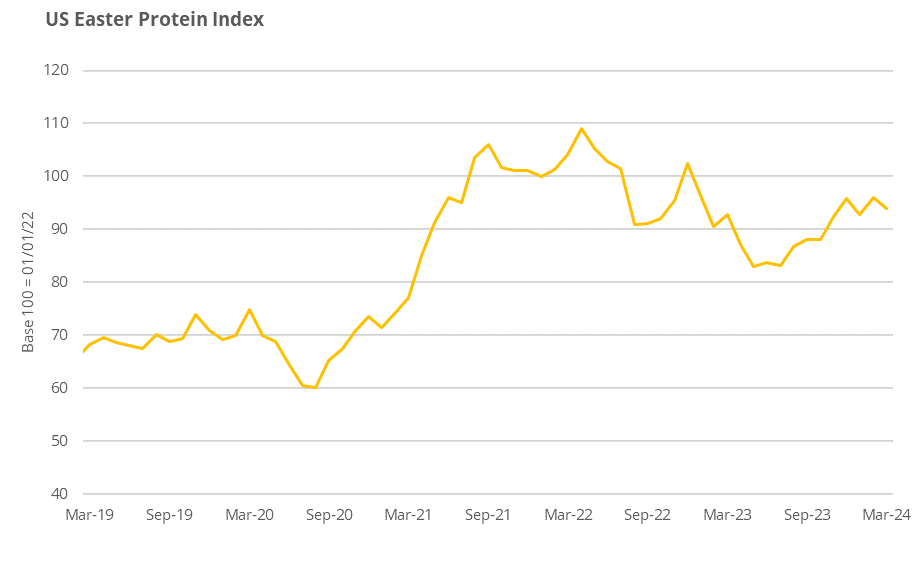
The US Easter Protein Index rose marginally by 1.2% y-o-y, while the US Easter Bakery Index fell by 2.4% y-o-y,
Mintec US Easter Index
The overall US Easter Index increased marginally by 13.5% y-o-y, reflecting mixed fortunes across the sub-indices.
The US Easter Protein Index, rose marginally by 1.2% y-o-y. This was driven by a 14.6% y-o-y increase in the lamb price, which outweighed cheaper prices of the other five constituents.
Consumers are poised to pay substantially more for the traditional chocolate Easter eggs this year, as evidenced by the US Chocolate Index increasing by 88.8% y-o-y. This was underpinned by record high cocoa prices.
The US Easter Bakery Index fell by 2.4% y-o-y, with lower wheat, milk and egg prices outweighing higher-priced butter and sugar.
Source: Mintec Analytics and Urner Barry
US Easter Protein Index (lamb, beef, pork, salmon, cod, eggs)
Source: Urner Barry
The US Easter Protein Index, rose by 1.2% y-o-y in March, which was mainly influenced by firm lamb prices, which reacted to supply tightness and rose by 14.6% y-o-y, and was partially mitigated by cheaper prices of beef (-4.2%), ham (-0.4%), salmon (-6.9%), cod (-6.5%) and eggs (-28.1%).
Breakdown by Components
Easter Protein Index (lamb, beef, pork, salmon, cod, egg)
Source: Urner Barry
Lamb
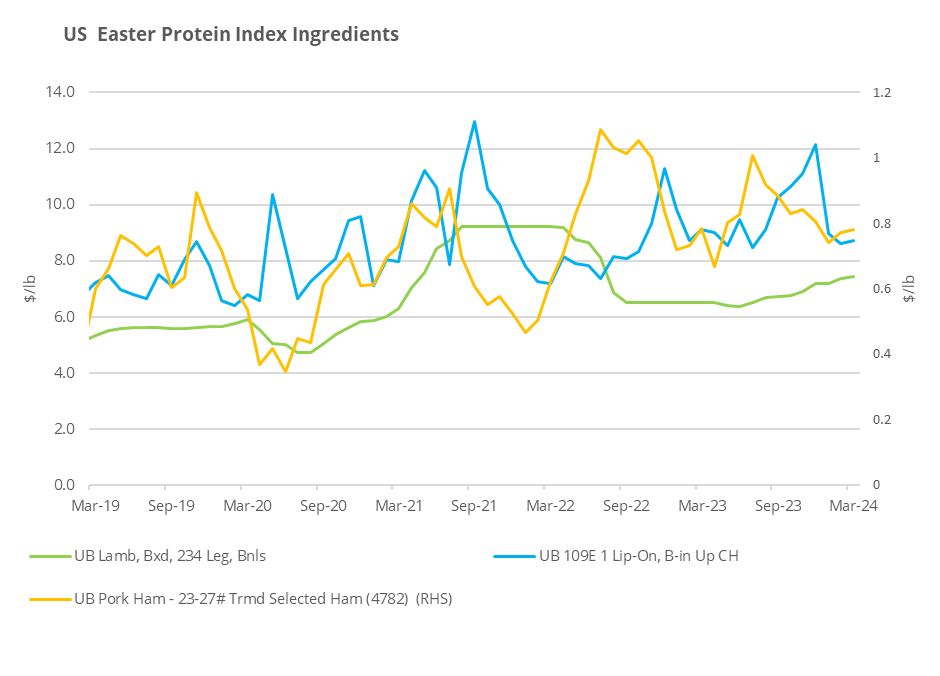
The Urner Barry boxed domestic boneless lamb leg price experienced a modest uptick of 1.4% m-o-m, settling at $7.45/lb. This increment is also part of a notable 14.6% y-o-y increase in price. Premiums on domestic product this year can largely be attributed to tighter production figures compared to this time last year.
When analyzing the boneless lamb leg price, it is common to observe a price increase as market demand improves at the retail level. This is particularly noticeable around the Easter holiday as it is a symbol of renewal. To accommodate this heightened demand, suppliers and retailers work diligently to ensure an adequate supply of lamb legs ahead of these holidays, sourcing from both domestic production and import channels. Total year-to-date fresh volume traded on the spot market has increased by 13.2% compared to the same period last year, while the total year-to-date frozen volume has decreased by 1.8%. However, when examining imported Australia/New Zealand material, there has been an increase of 26.3% for total year-to-date imports of fresh products and 6.1% for frozen products. This trend is partly attributed to the decline in domestic lamb slaughter figures amid minimal domestic consumer interest outside of the Christmas and Easter holidays.
Beef
The US beef price eased from record highs last year and helped mitigate costs in the Easter dinner index. The average price of UB 109E 1 Lip-On, Bone-In Up Choice (Rib Roast) in the US decreased by 4.2% y-o-y to $8.77/lb in March 2024.
While prices have eased from seasonal records last year, they remain elevated, sitting at the second highest price on record for March. The cattle cycle is still in contraction, all cattle and calves in the United States on January 1 were 87.2 million head, 2% lower than 2023, and the lowest January 1 inventory since 1951. Drought and rising input costs to maintain herds are factors driving the tighter supply picture. Demand remains robust for beef as consumers’ willingness to pay remains evident.
Pork
The Urner Barry 23/27 average monthly bone-in ham pork price experienced a minor decrease of 0.4% m-o-m with the price settling at $0.78/lb for March. Conversely, upon reviewing the average price on a y-o-y basis, the bone-in ham price in the US showed a slight increase of 1.2%. This y-o-y price increase is partially due to less bone-in hams being sold on the spot market this year and more product being sold on a formulated basis.
Typically, around this time of year, the pork market experiences a decline in hog weights and slaughter figures as we move closer to the spring season. This historical trend usually leads to tighter production figures due to the changing weather conditions. Another consistent factor influencing the pork market this year is the robust demand from the Mexican market for US bone-in hams, driven by favorable currency exchange rates. Additionally, some domestic retailers took advantage of lower spot market prices at the end of January this year to stock up in anticipation of Easter consumer purchases. After Easter most purchases on the spot market are aimed at placing product into cold storage for summertime deli meat demand and 2024 holiday preparations.
Source: Urner Barry
Salmon
Typically, the start of Lent with Ash Wednesday, Valentine’s Day, and Chinese New Year are the farmed salmon market’s demand trifecta. All are demand-boosting events that usually see increased activity for farmed salmon in both the Foodservice and Retail markets. This year, many market participants would argue that these events did not hit their mark.
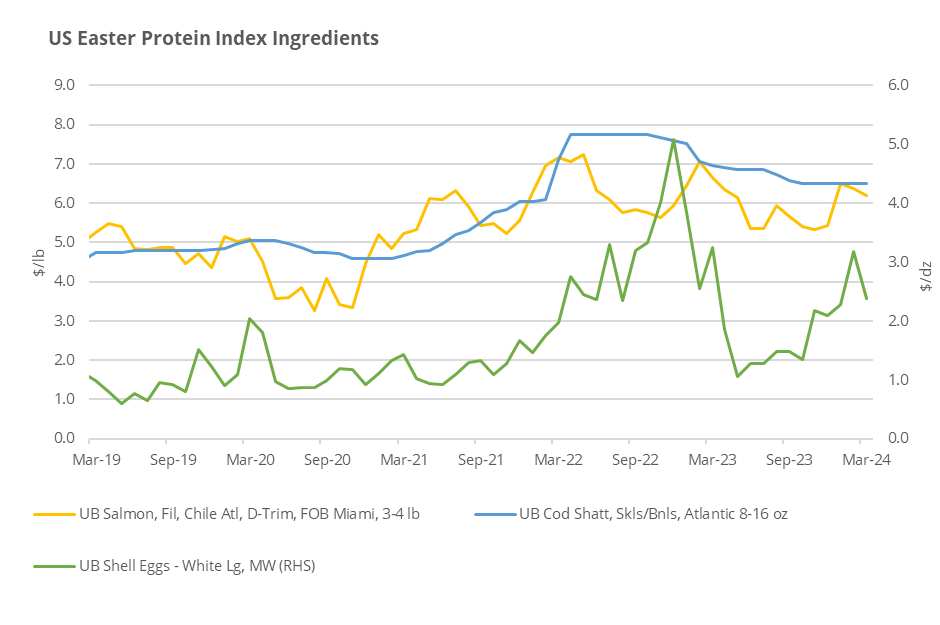
The farmed salmon complex has been anywhere from steady to weak throughout most of the Lenten season. Urner Barry’s farmed salmon index has adjusted lower for five consecutive weeks during Lent with only Holy Week to go. Although 2024 is still hovering above the five-year average, still up 7.7%, there has been a downward pricing trend.
Moving deeper into March, market participants report the Chilean fillet market to be more stable to firming while out of Canada we continue whole fish availability increase and thus pricing has been barely steady to weak on all sizes. The undertone on both coasts of Canada is unsettled with offers varying widely. Heading into the middle of Lent, from an historical standpoint, retail features are usually strong into Holy Week, but 2024 appears to be tracking a bit differently.
Cod
In 2023, the U.S. experienced a notable shift in its cod import patterns. Overall, there was a 22.4% reduction in imports, totaling a significant decrease of 28 million pounds from the previous year, bringing the year's total to 97.8 million pounds. Notably, in December, there was a slight uptick in frozen cod fillet imports of 2.2%.
Major exporting countries showed varied trends. Norway's exports to the U.S. plummeted drastically by 93.2% year-over-year, continuing a downward trajectory for the second consecutive year. Similarly, no imports were recorded from Russia, in line with the ongoing U.S. ban on Russian products. China, after a 12.8% increase in 2022, saw a sharp 23.6% decrease in 2023, equating to about 19 million pounds less in frozen fillets from the previous year.
During the 2023 Lenten season, pricing, although 6.5% higher than where the market currently stands in March 2024, was adjusting lower as supply constraints stemming from the Russian ban improved. The 2024 Lenten season, however, has witnessed moderate to active demand across the groundfish complex, including cod, maintaining a full steady undertone in the market.
Nevertheless, the market is marked by significant unease as it progresses into 2024, primarily due to legislative actions targeting Russian raw materials processed in China. This legislation has led to upward pricing pressure on twice frozen products, impacting the pricing of single frozen products as well, as the margin between these product forms narrows. These developments add uncertainty, especially considering the existing product in the U.S. and potential delays in the legislation's impact. Consequently, the current Lenten season continues to experience elevated replacement costs overseas, with the market tone remaining full steady to firm.
Egg
The US egg market surged to record heights for the month of February due to a Q4 2023 outbreak of highly-pathogenic avian influenza (HPAI), commonly referred to as the bird flu. The resurgence of HPAI in late October marked the end of a roughly 10-month period without any major detections among table-laying hens. Approximately 15 million commercial hens and pullets were lost to the virus in the following months, leading to a drastic drop in national production levels. USDA data shows that at the beginning of February, production stood at just 309 million layers, which compares with a five-year February average of 327 million layers.
However, the surge in market values was NOT solely due to supply-side limitations. Strong demand in the retail sector also played a significant role. In addition to strong seasonal demand, several major retail chains across the country were utilizing eggs as a loss leader. By offering eggs at a discounted price, these retailers attract customers who are likely to purchase additional items , thereby bolstering overall sales and foot traffic. This strategy proved highly effective, driving exceptionally strong sales at a time when producers were already grappling with supply constraints.
The market began correcting in mid-February as higher wholesale prices eventually trickled down to the consumer level, dampening demand. Prices plunged 37% in the three weeks ended March 5th, eventually stabilizing at $2.31/dozen. While this figure was significantly lower than the $3.37/dozen seen in February, it remained remarkably high compared to historical norms, prompting many stakeholders to ponder whether the usual pre-Easter rally would occur or if it had already been reached, considering the already elevated prices for this time of year.
The question was answered the following week when prices began to rise once again, albeit at a moderate pace. Similar to domestic retailers, Canada had been preparing for heightened Easter demand and relying on the US to help address its supply shortages. This increased demand absorbed available supply, resulting in prices climbing to $2.56 per dozen.
US Easter Chocolate Index (cocoa, milk, sugar)
Source: Mintec Analytics
The Easter chocolate index includes cocoa, skimmed-milk powder and sugar. The index price of Easter Chocolate commodities rose by 31.5% y-o-y in March 2024, with soaring cocoa prices offset slightly by weaker non-fat dried milk and other dairy prices. As chocolate prices have risen, manufacturers have scrambled to secure supply amid a reduction in bean – and thus product – availability.
Cocoa
Source: Mintec Analytics
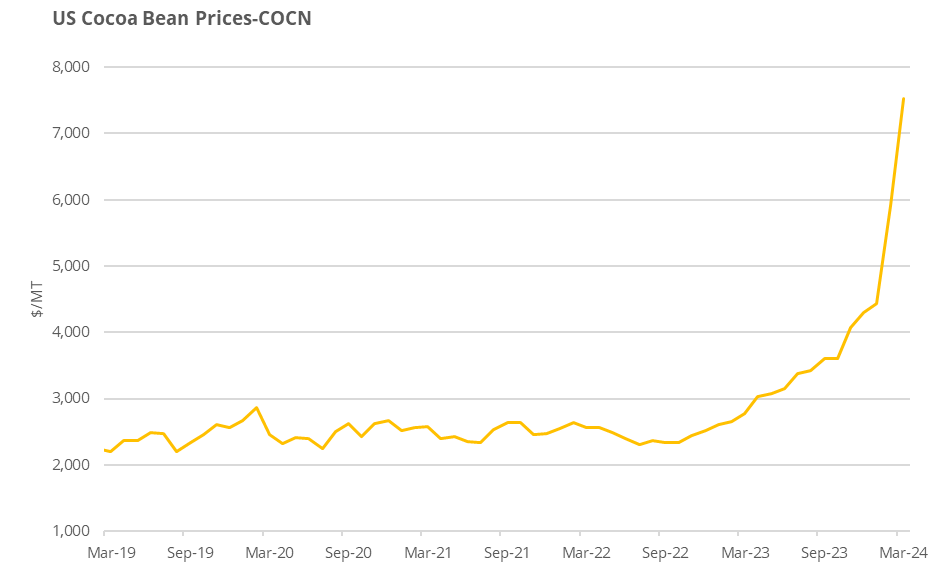
Cocoa bean futures on the spot ICE New York exchange shot well beyond the previous all-time high set back in 1977. The previous high of $4,854/MT set in July 1977 was surpassed on February 1st, 2024, and spot prices have continued their meteoric rise to trade at around $8,300/MT as of late March. The rise has been attributed to a number of factors, chiefly the drop in production so far this year, with Mintec sources estimating that production for 2023/24 is likely to be some 10-15% lower than 2022/23. Much of this drop can be attributed to an increase of instances of the Swollen Shoot Virus (SSV) which destroys tree productivity in west Africa. In addition, other factors such as neglect, a lack of fertilizers and other inputs, low and delayed farmgate payments to farmers, new EU deforestation legislation, and robust consumer demand have all contributed to higher cocoa bean prices over the past year.
In addition, the two key cocoa components of chocolate – cocoa butter and cocoa liquor – have seen their increases far surpass those of the cocoa bean due to pricing ratios set by major processors. These ratios have seen the price increases for butter and liquor nearly double those of the cocoa bean. Ratios have moved higher since the early part of 2024 due to higher bean costs, rising interest rates and storage costs, higher overall costs of production, and consistent demand from manufacturers who have very low levels of cover for chocolate and cocoa products. Mintec is now hearing from many manufacturers and retailers that few offers are available in the market due to a lack of supplies of chocolate and cocoa products, despite most buyers having very little cover on hand, which is causing some switching and reformulation away from traditional chocolate products and towards alternatives like compound, where cocoa fats such as cocoa butter are substituted with vegetable oil. “Shrinkflation” is becoming an increasingly common way to mitigate the rising price of chocolate as well.
Milk
Source: Mintec Analytics
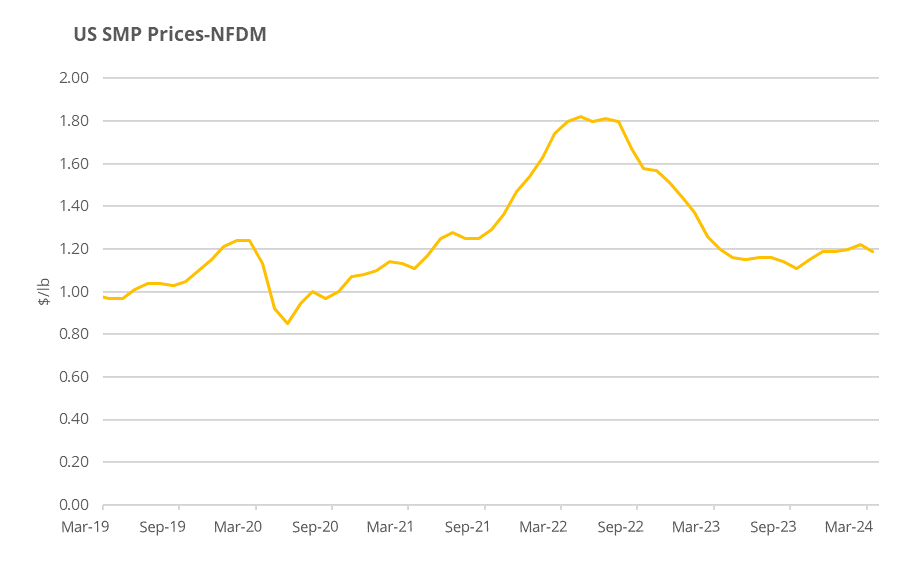
The Mintec benchmark price for NFDM was assessed at $1.18/lb down 12.4% y-o-y. Weak domestic and international buying interest has weighed on US NFDM prices throughout 2023. Which negatively impacted the NFDM production throughout the US. Domestic demand was negatively impacted by reduced consumer demand as US households struggled with inflationary challenges throughout 2023. Weak US exports can be linked to competitive price levels from other international regions such as New Zealand and South America. While the production output during the first 6 months of 2023 surpassed the production volumes of 2022 for the same period. The production output for the second half of 2023 was reported below the volumes of 2022 throughout the same period. This can be linked to producers channeling milk into more profitable commodities such as cheese. According to multiple market sources, NFDM production remained weak during Q1 2024 as producers continued to favor other dairy commodities over NFDM, which adds a slight bullish undertone to the market as stocks have been reported tight throughout the US.
Sugar
Source: Mintec Analytics
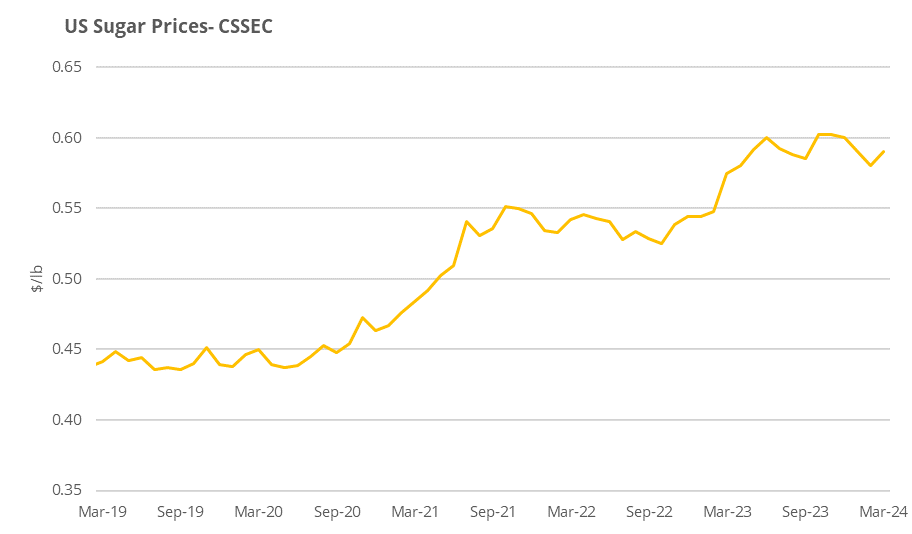
The Mintec Benchmark Price for cane sugar contract FOB Southeast increased 8.5% y-o-y in March, while beet sugar contract FOB Midwest prices have been mostly steady throughout the past year. The higher prices can be attributed to tightening supply and increasing demand. Despite recent futures volatility, sources tell Mintec that spot and contract sugar prices are lower in Q1 2024 compared to a year ago. While prices remain high, the US sugar market is steady with a soft undertone, as deliveries have been slow amid ample beet sugar supplies and overbooking by buyers in 2023. The market declined through November 2023, and there seems to be more opportunity to strategize this year rather than rush to secure supply. However, some players note that there has been an uptick in bulk movement in the weeks leading up to Easter. Meanwhile, the USDA reported that imports of high-tier sugar reached a record high for 2023/24, due to a lack of imports from Mexico. Market participants will be closely monitoring Mexico and Brazil’s production levels, as this could strain supply in the domestic market and cause an increase in prices.
Easter Bakery Index (wheat, butter, sugar, milk, egg)
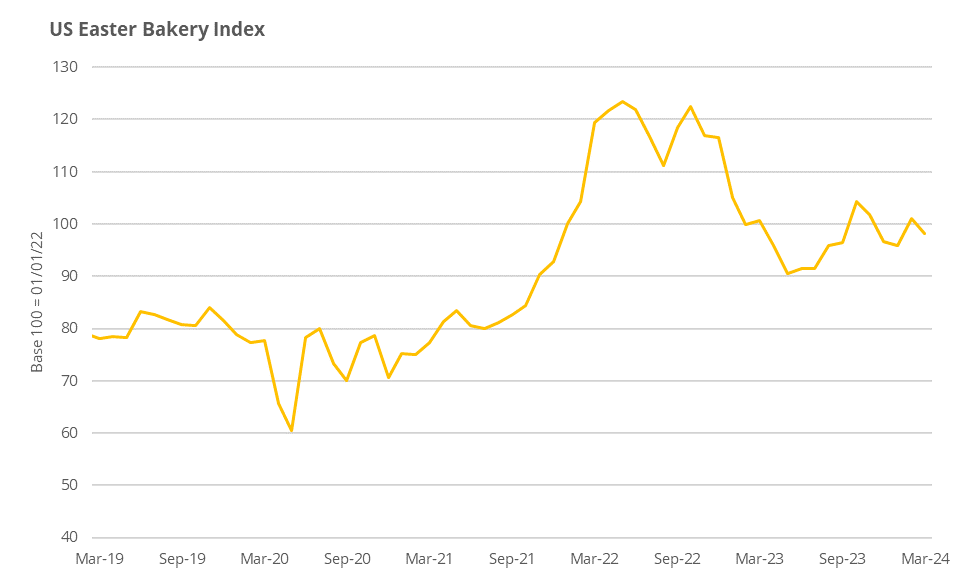
Source: Mintec Analytics & Urner Barry
The US Easter Bakery Index fell by 2.4% y-o-y with wheat declining (-22.1%), alongside milk (-7.6%) and eggs (-28.1%), offsetting higher prices of butter (+16.6%) and cane sugar (+2.6%)
Wheat
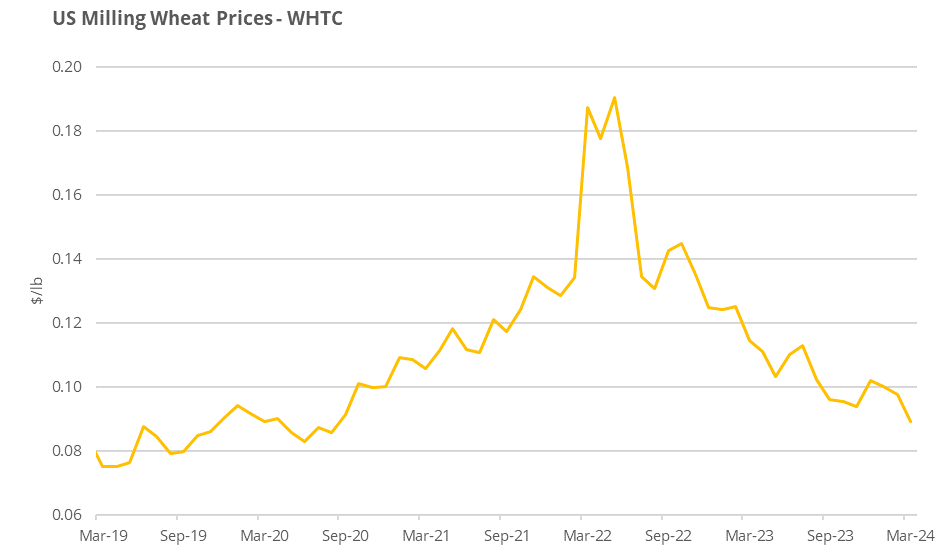
Source: Mintec Analytics
In March, the average price of CBOT wheat experienced a monthly decline of 4.9% and a y-o-y decrease of 16.4%, settling at $203.8/mt. This drop in the CBOT (CME) milling wheat futures price was attributed to subdued demand and the presence of competitive wheat supplies originating from the Black Sea region. Attention among market participants is focused on the early growth stages of wheat in the US, with forecasts indicating unseasonably warm temperatures. However, it is noted that the wheat harvest is approximately three months away, with crop conditions showing significant improvement from the previous year in key growing regions. Nonetheless, the forthcoming months will see continued scrutiny of crop conditions in the US and Europe, alongside Chinese wheat demand and fund activity, as pivotal factors influencing market dynamics.
Butter
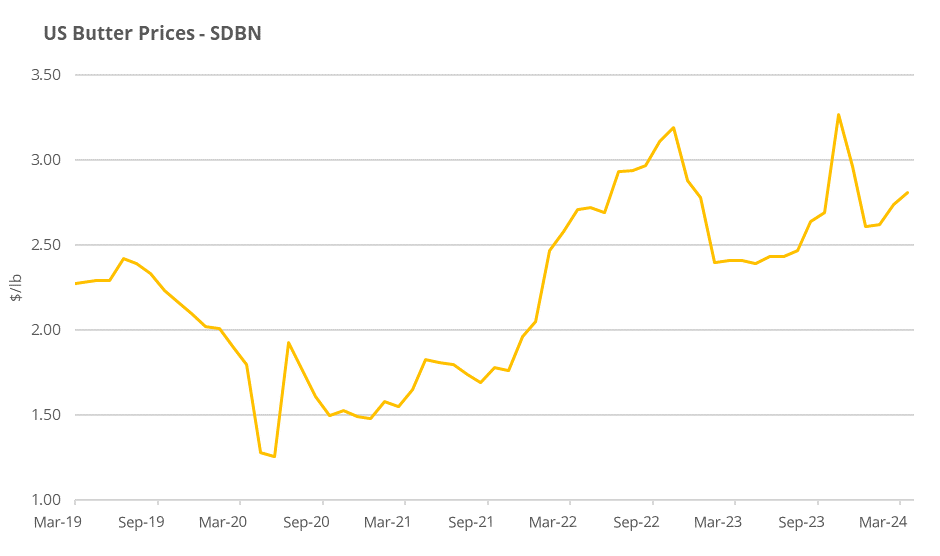
Source: Mintec Analytics
Mintec benchmark price for butter was reported up 2.6% during March to $2.82, which reflects an 16.6% increase on the year.
Retail demand for butter remains strong. According to multiple market sources, the upcoming easter holiday supported demand throughout the US, with particularly strong demand in the western US. Additionally tight butter supply supported a bullish market sentiment for US butter, as stock throughout the US remained low. Tight butter stocks and increasing prices have supported the US butter production during Q1 2024 according to multiple market sources, as more processors challenge milk into butter production. However, the recent increase in butter production was not able to offset the bullish pressure added to the butter market thorough 2024 from tight availability and steady demand.
Milk
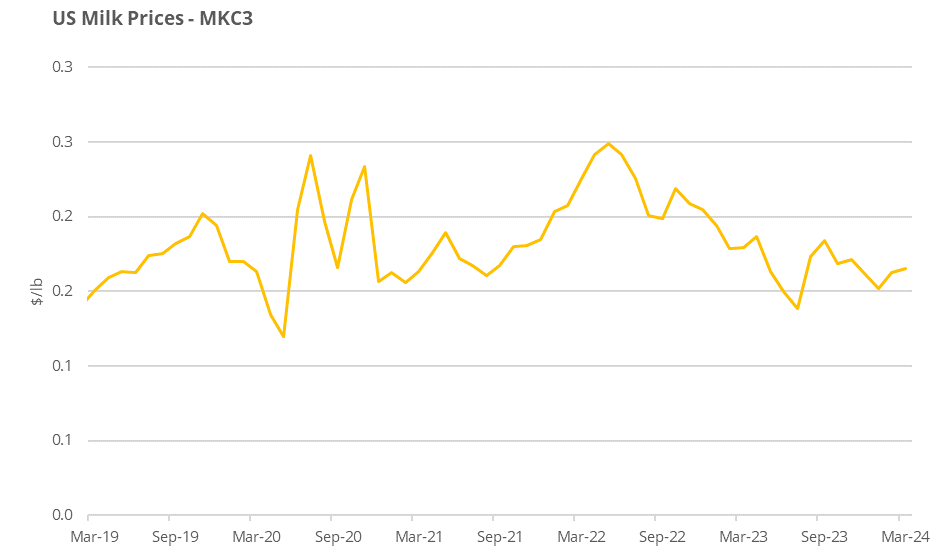
Source: Mintec Analytics
The Mintec price for US Milk was assessed at $0.16/lb during March, an increase of 2% on the month, however a decrease of 7.6% on the year. US milk price have decreased since September 2023, supported by increasing milk supply across the US, even though some of the key producing regions in the US indicated weaker milk intakes during the second half of 2023, 2023 milk intakes have been reported 1.2% above 2022. This continued until January 2024, with prices increasing during February and March. Recent price increases in the US can be linked to steady demand, in combination with a slow start for milk production according to multiple market sources.
Conclusion
Mintec’s 2024 US Easter Index shows that the average US household is expected to pay more for traditional food and confectionary this Easter, when compared to Easter 2023. Inflation has been the key macroeconomic theme of the past year and while some indicators have slowed since the turn of the year, food prices remain volatile. The blended price of chocolate ingredients in March 2024 is 89% higher than last year, which is entirely attributable to the record high prices of cocoa that continue to soar. Given the high cost of chocolate, households are expected to reduce Easter egg consumption this year, with some expected to completely abstain. This may prompt some consumers to find alternative cheaper sweets in grocery stores, while others will be encouraged towards home baked treats, as more cost-effective options this year, or seek healthier options, such as fruit.
Among the protein category, pork is likely to be the winner this Easter, when considered against lamb and beef. As a cheaper meat, pork has cost advantage over the other meats and the pork price is also cheaper y-o-y in 2024. In contrast, the lamb price has risen by 15% y-o-y, while beef, despite falling in price y-o-y, remains the most expensive meat. Fish is traditionally eaten on Good Friday and supply tightness supports more expensive cod and salmon prices y-o-y in 2024. As of March 2024, Cod is around 5% more expensive than salmon on a pound-for-pound basis, and the price premium of cod over salmon is almost the same as Easter 2023. On this basis, US households may opt to consume more salmon at the expense of cod this year.
The US Easter Bakery Index fell by 2.4% y-o-y, which represents considerable cost savings when compared to buying chocolate-based confectionary. This could fuel a strong substitution effect towards home-made treats this Easter among cash-squeezed households.