Analyse the impact of changing weather conditions.
How is the weather impacting the price of your commodities?
Commodity Weather Analysis
Weather pattern analysis delivers more acurate commodity price predictions.
Commodity Weather Analysis
Analyse the impact of changing weather conditions on specific crops.
Commodity Weather Analysis
Vegetation Index provides a comprehensive view of crop health.
Weather Maps & Reports
Focus on specific Growing Areas for your commodities.
Crop Calendars
Stay updated with Crop Growing Stages for your commodities.
Comparison Years
Compare with other years of high and low yields.
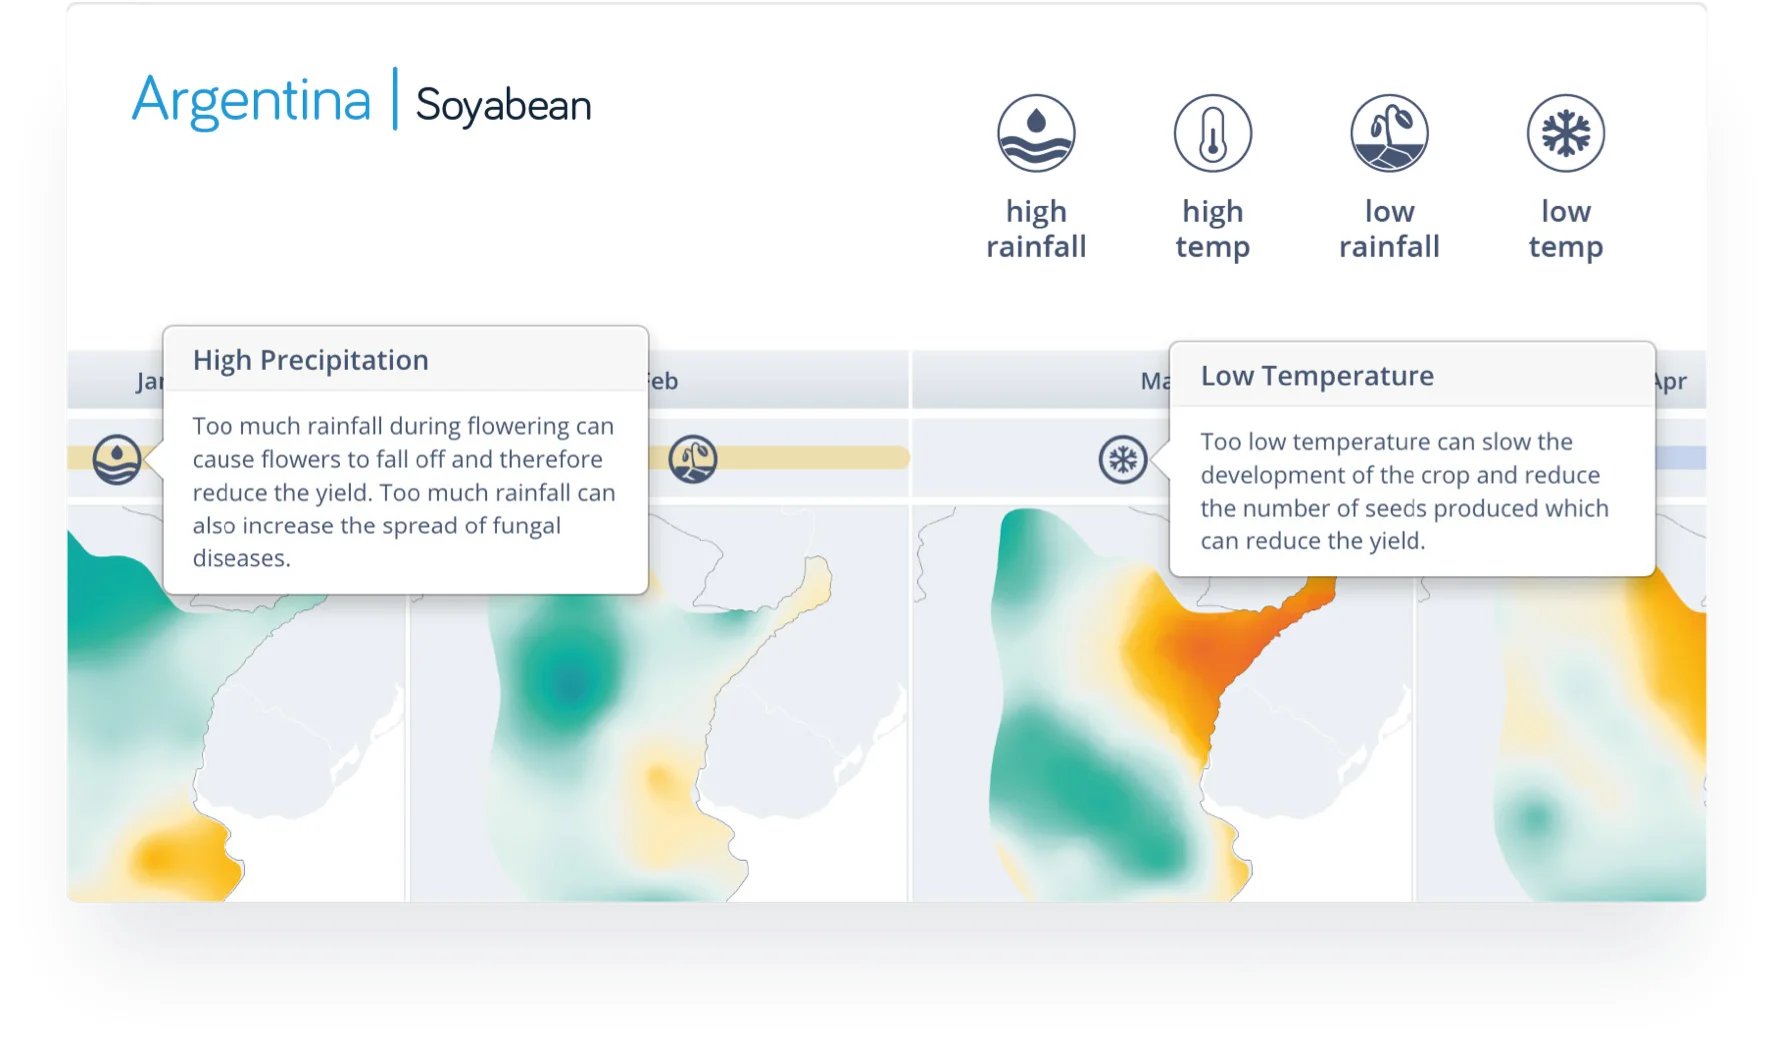
Critical Conditions
The effects of Critical Weather Conditions during the seasons.
Vegetation Index
a comprehensive view of crop health.
Mintec Extreme Weather Hub
How are extreme weather events impacting the agri-food supply chain? What are the latest weather anomalies affecting global crop production today?
How can the Weather Analysis help you?
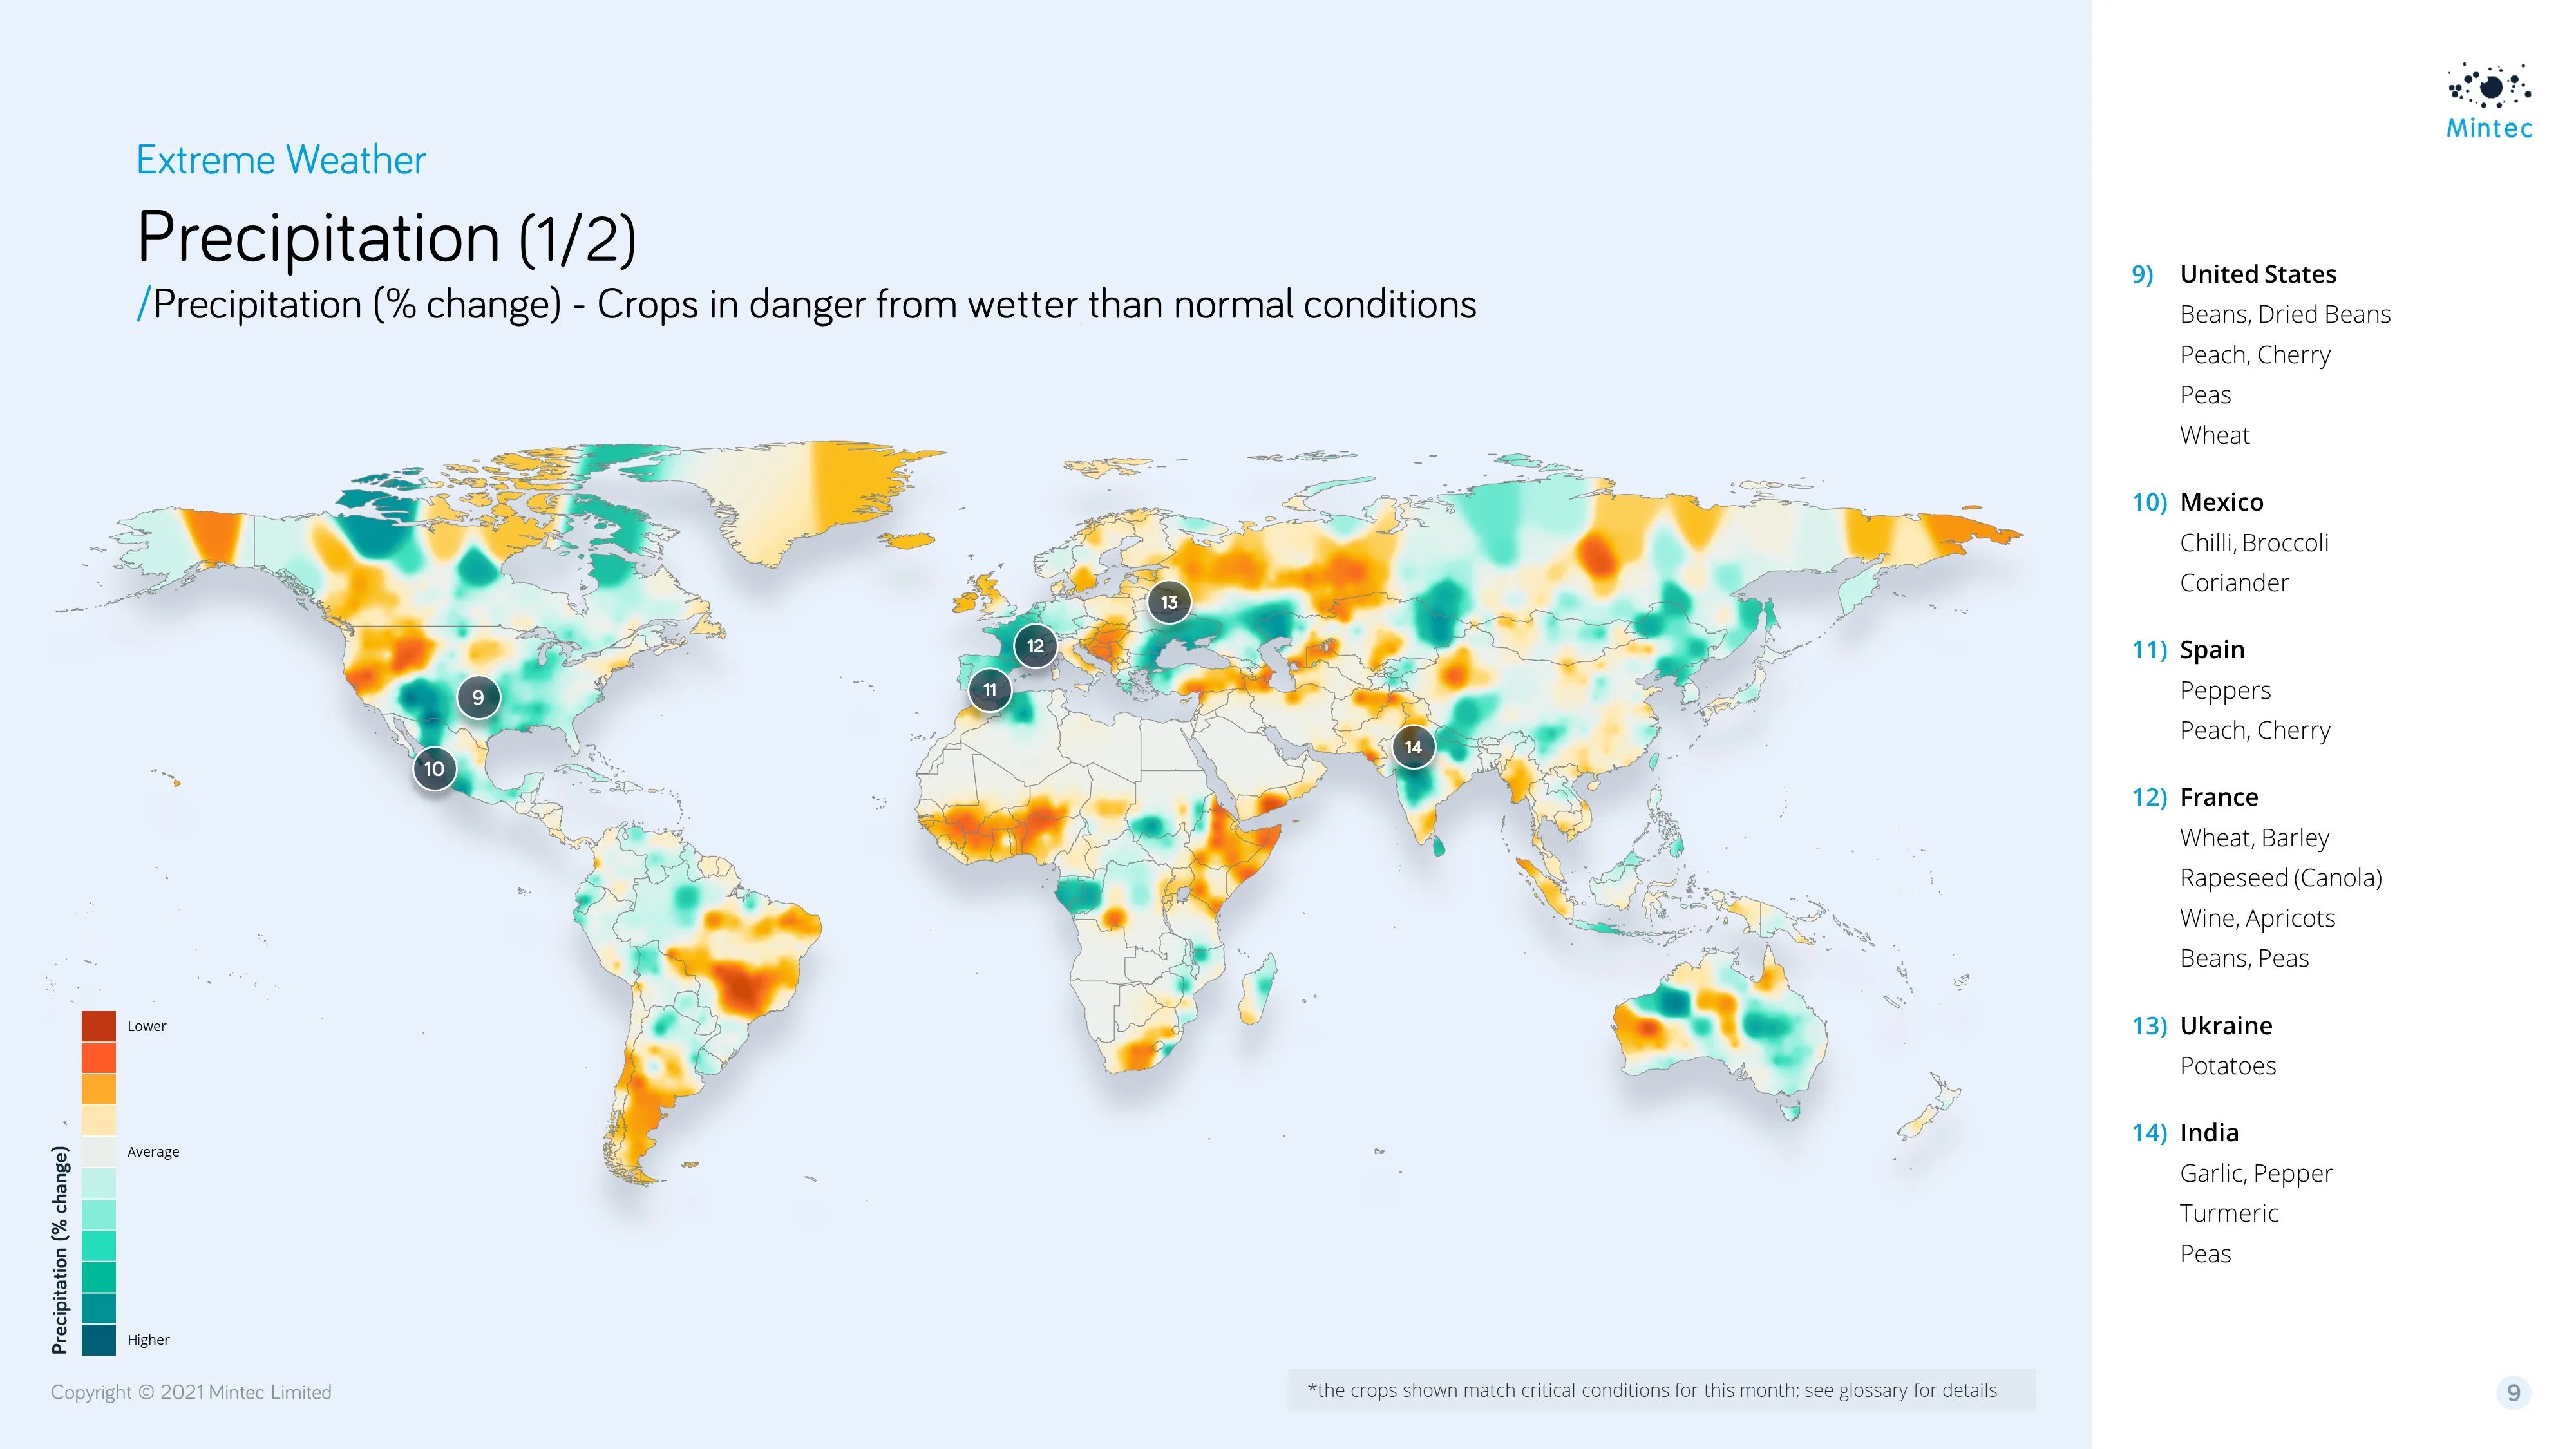
Weather Maps & Reports
Use the weather maps to compare changes in precipitation and temperature levels for specific commodities with 30 years of averages. View the major growing areas of the commodity for agricultural crops using our Crop maps or Country maps for all other commodities.
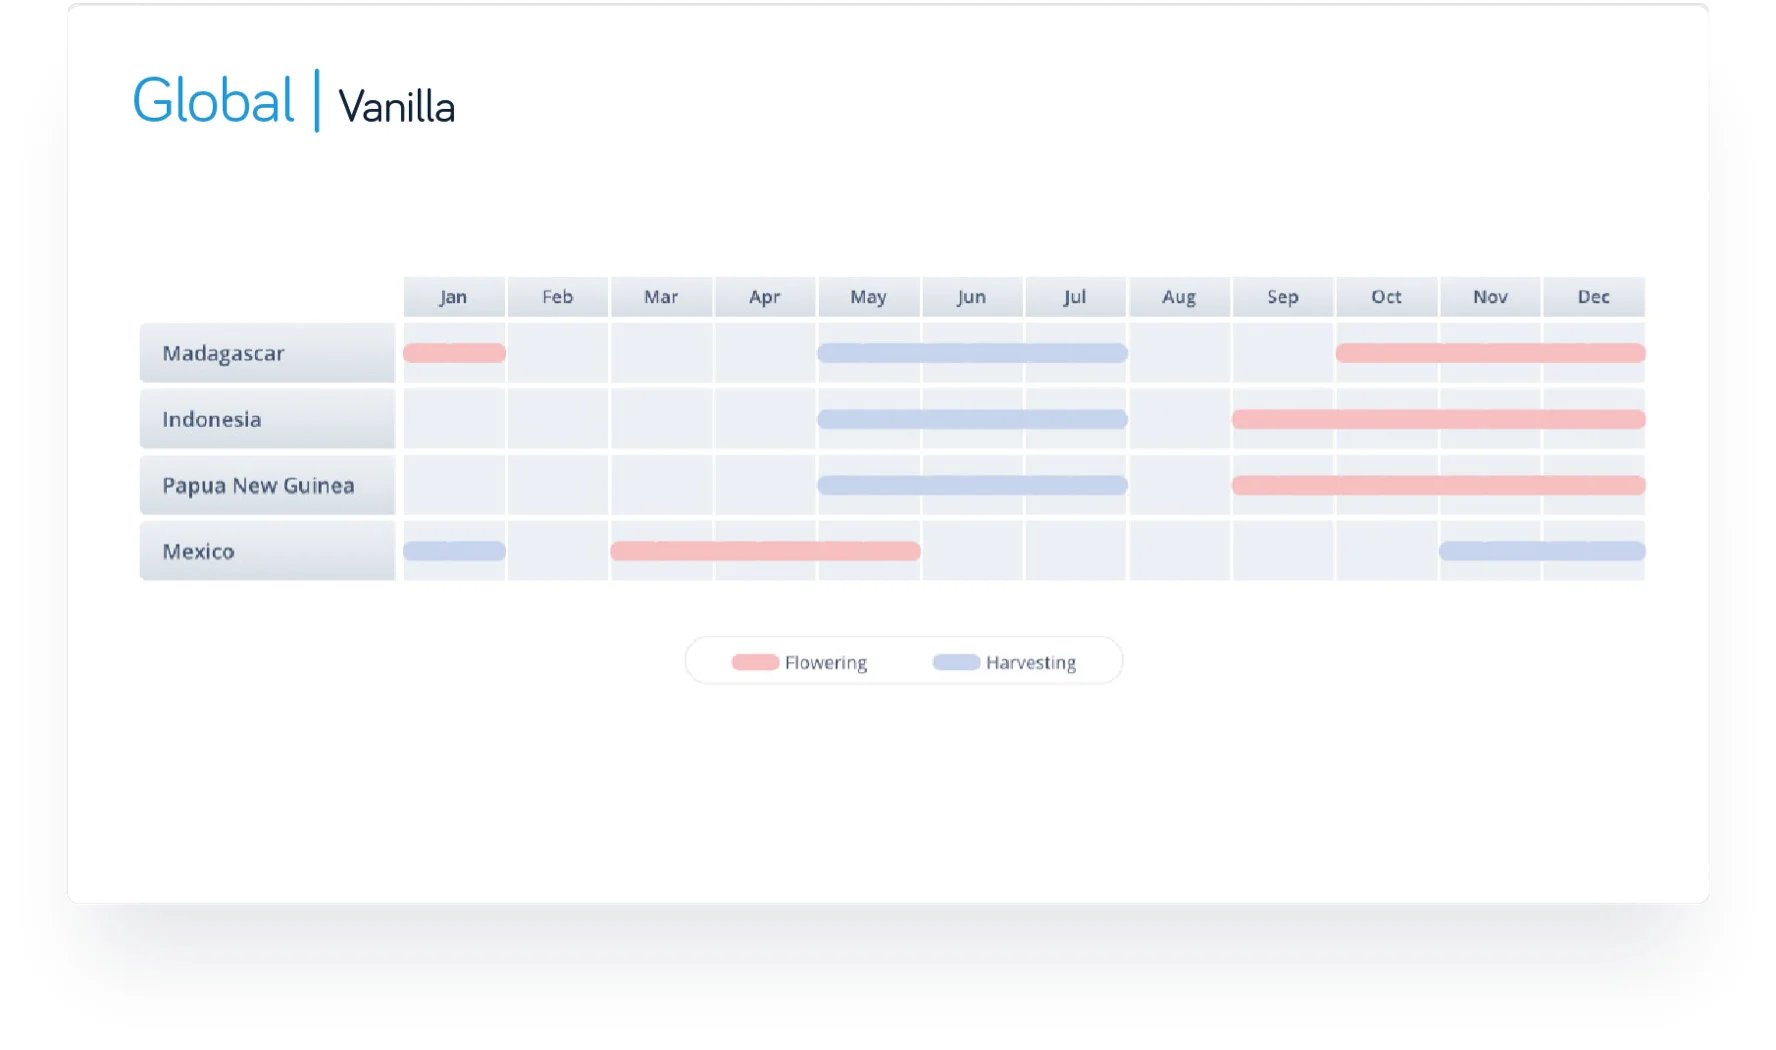
Crop Calendars
Crop calendars highlight the growing stages of the crop and are shown on both the Facts tab and the Weather tab, you can easily see when the planting season starts and finishes as well as other key stages such as flowering and harvesting.
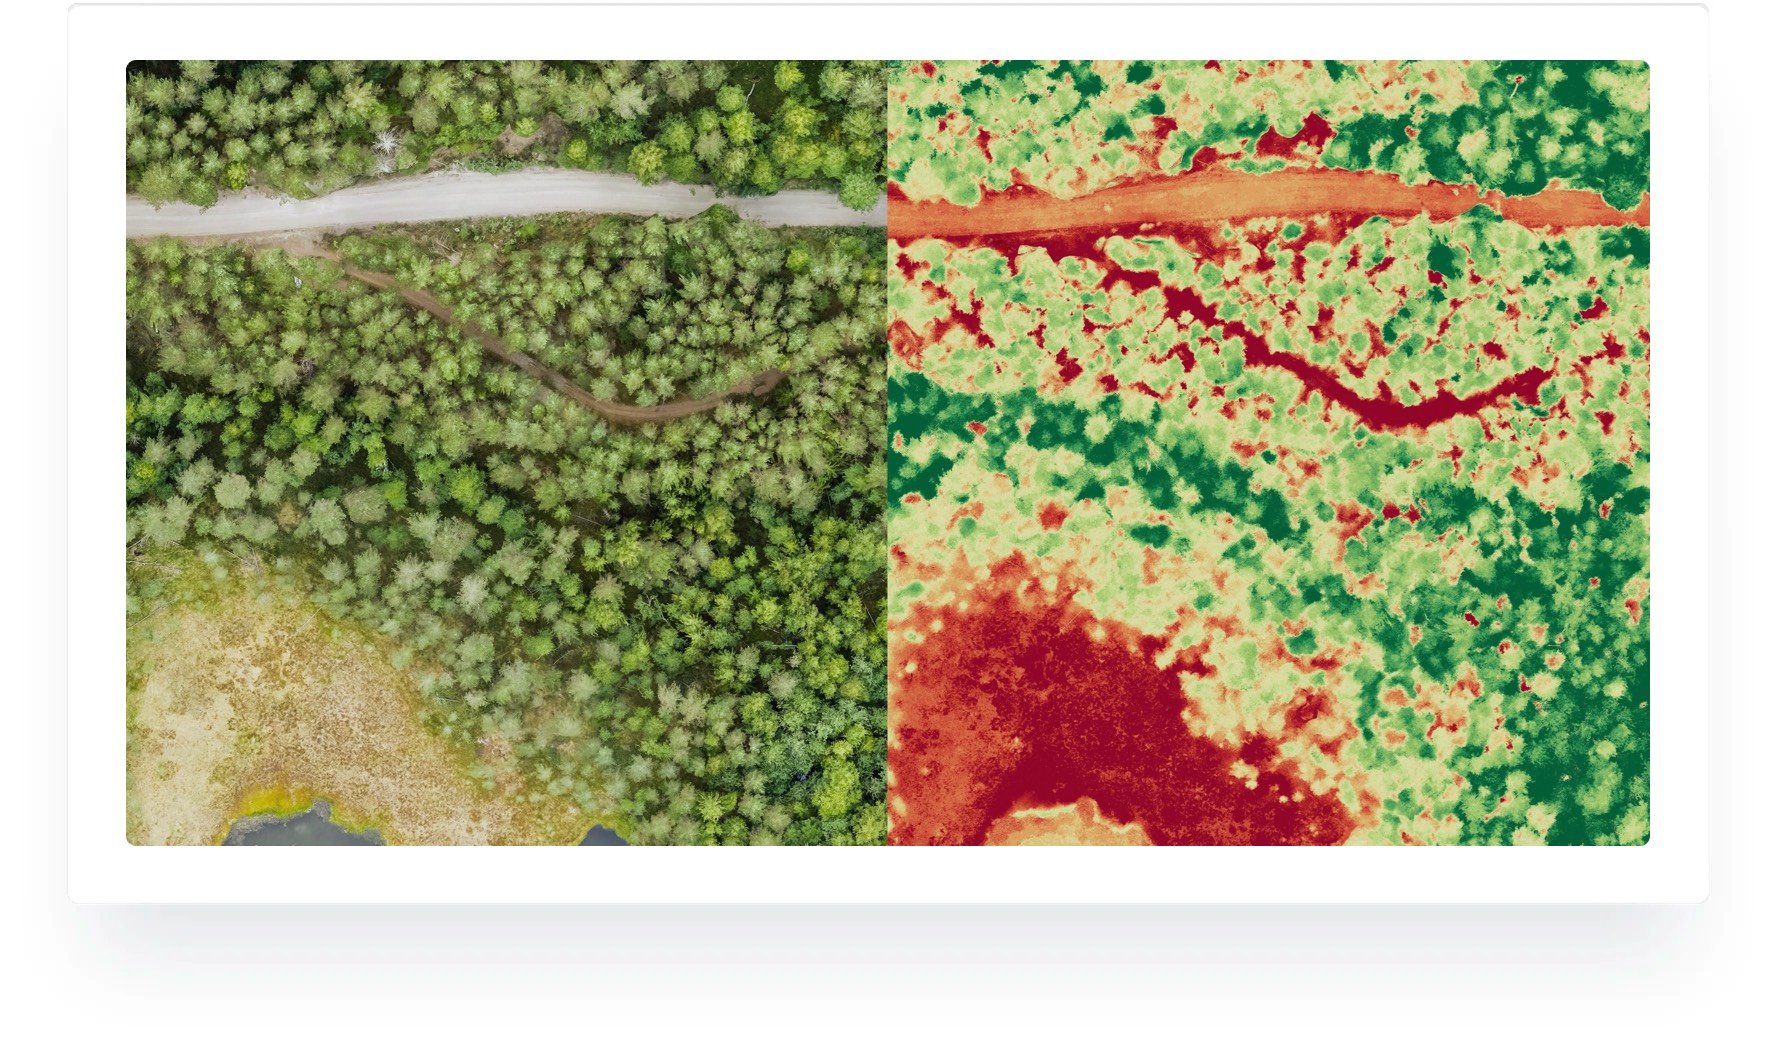
Vegetation Index
The Normalized Difference Vegetation Index (NDVI) measures the health and vitality of vegetation by analysing the reflection of near-infrared and visible light. By utilizing this index, agrifood companies gain a deeper understanding of how weather conditions impact crop growth, enabling them to anticipate and respond to potential disruptions.
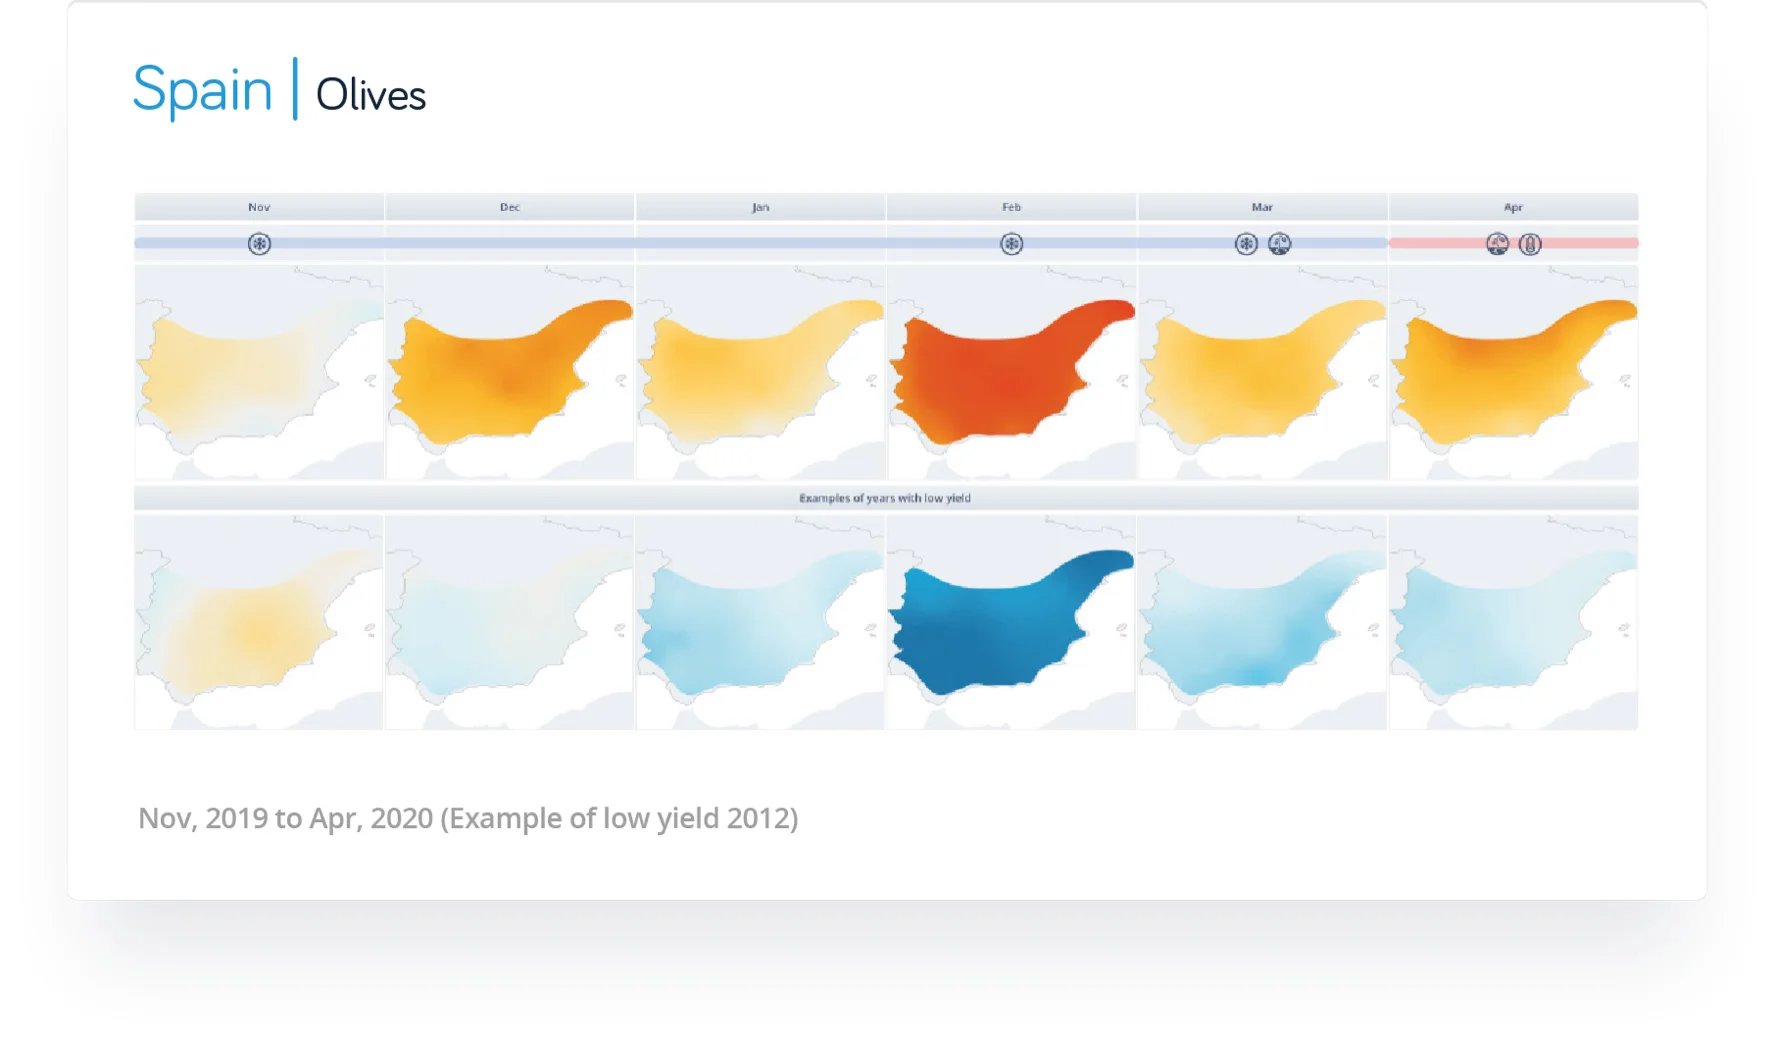
Comparison Years
Create more informed predictions based on past events using our comparison years to compare the current year against an example of previous years where weather conditions significantly impacted the yield.
Critical Conditions
Critical conditions display additional information on how weather can negatively impact the crop. They highlight when the crop is most sensitive to the weather anomalies.
PLATFORM
Mintec Analytics
The spend intelligence you need, about the food products you buy, all in one place.
 Mintec Ltd